Lyft Data Challenge
Ranked 3rd of 250 teams in nationwide data challenge!
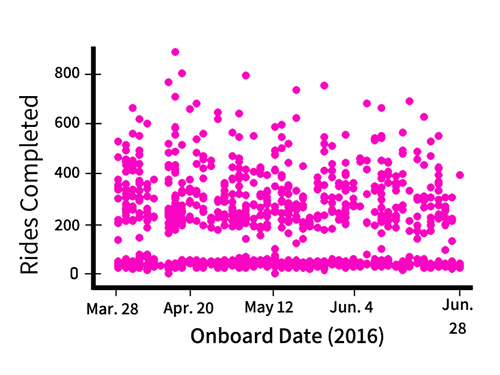
The Lyft data challenge was a two part competition open to undergrad and masters students. I competed in this with The first part of the competition had us explore the lifetime value of drivers and the factors which influence that value. In our exploratory analysis we found that there is a clear barrier in getting drivers to complete their first 100 rides. This makes sense, since that is the period where the driver is deciding if they like the job. A key realization is that once a driver completes 100 rides, they are 4x less likely to quit. Thus, we decided to explore what factors lead a driver to complete 100 rides, so we trained a decision tree to answer that question.
Here you can see that the biggest factors at play are the number of rides completed in the first week, as well as commute/wait time. Essentially we learned that drivers who are active in their first week, and are given high reward rides are most likely to stay. Ultimately our analysis in the first part of this competition advanced us to the final round in San Francisco!
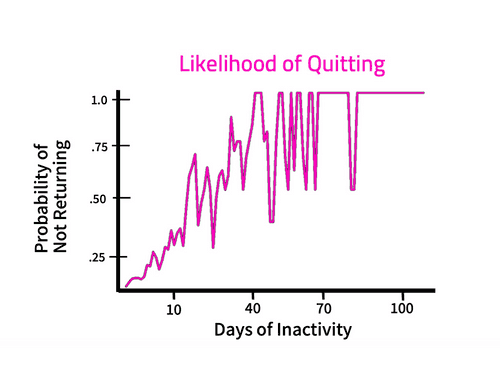
The final round was a fast in person challenge, asking us create a clear definition of driver churn. Driver churn is a formal way to say that a driver has quit, as opposed to taking some sort of break. To answer this, I was interested the likelihood of a driver returning given the number of days that have been inactive. This painted a rather clear story, showing us that drivers who are inactive for 22 days are 50% likely to return, thus we used this to define churn. Ultimately, this analysis placed us in 3rd overall, and resulted in both my partner and I earning summer internships at Lyft!
Here's the full paper!

